In the paper, we present results using conditional log-likelihood and the area under the precision-recall curve. For each, we present both the sample mean, and standard deviation of the sample mean. While straightforward for the conditional log-likelihood, it is not obvious how to compute the deviation for the area under the precision-recall curve. The purpose of this addendum is to explain how this computation is done. In the following, let pi be the probability assigned to point i, and ci be the class (0 or 1) for point i. Let “true points” be the set of points where ci=1.
Below is a sample precision-recall curve. We have rotated the curve so that the x-axis is precision and the y-axis is recall (this does not affect the area under the curve). The purpose is to compute the shaded area, as a mean of a number of samples, such that we can also compute the standard deviation of that mean.
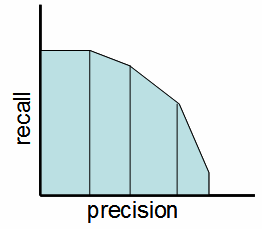
We approximate the precision-recall curve by using a set of thresholds, plotting the precision and recall for each threshold, and connecting the points with a line. The curve can thus be viewed as a set of trapezoids, the area of which is an approximation to the area under the true precision recall curve (with the approximation becoming better as more thresholds are employed).
Notice that, since the scale for prevision and recall are 0 to 1, the area under the curve is simply the weighted average height of the trapezoids, where the weight is the width of each trapezoid. The height for a given threshold, t, is the average, over all true points, of 1 if pi>t , and 0 otherwise. Since we are taking the weighted average of an average (and the inner average is always over the same number of points), we can reverse the two and instead compute the area as the average over all true points, of fi. Where fi is weighted average fraction of thresholds for which pI is above the threshold, the weight wt being the half the width of the trapezoid to the left of the threshold, plus half the width of the one to the right.
Hence,
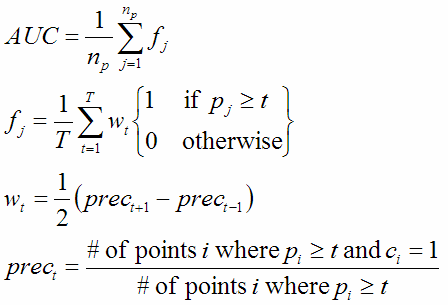
Where AUC is the area under the curve, j iterates over true points, np is the number of true points, T is the number of thresholds, prect is the precision at threshold t. For the border cases, let prec0=prec1, and precT=0 (this leads to a curve such as shown in the above figure, with a horizontal line to the vertical axis, and a vertical drop to the horizontal axis).
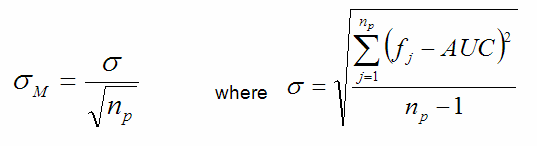
Notice that the AUC is computed as an average of samples, one sample per true point. This allows us to apply the standard computation for the standard deviation of the mean to find such for the area under the curve: