CSE142—Computer Programming I
Programming Assignment #6
Due: Wednesday,
Thanks to Nick Parlante of Stanford for the
original version of this assignment
Also see http://www.peggyorenstein.com/articles/2003_baby_names.html
This assignment emphasizes reading input from files in conjunction with many other things we have learned this quarter (e.g., loops, if/else, methods, and graphics).
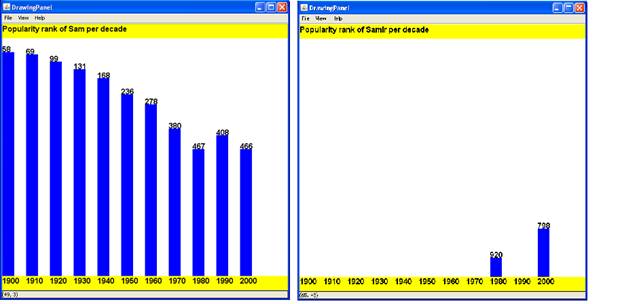
Your program will produce a bar chart
based on data from the Social Security Administration that is in a file. They provide a web site with the distribution
of names chosen for children over the last 100 years in the
...
Sam 58 69 99 131 168 236
278 380 467 408 466
Samantha 0 0 0 0 0 0 272
107 26 5 7
Samara 0 0 0 0 0 0 0 0 0
0 886
Samir 0 0 0 0 0 0 0 0
920 0 798
Sammie 537 545 351 325
333 396 565 772 930 0 0
Sammy 0 887 544 299 202
262 321 395 575 639 755
Samson 0 0 0 0 0 0 0 0 0
0 915
Samuel 31 41 46 60 61 71
83 61 52 35 28
Sandi 0 0 0 0 704 864
621 695 0 0 0
...
Notice “Sam” was #58 in 1900 and is slowly moving down. “Samantha” popped on the scene in 1960 and is moving up strong to #7. “Samir” barely appears in 1980, but by 2000 is up to #798.
Your program is to give an introduction and then prompt the user for a name. Then it will read through the data file searching for that name. The search should be case-insensitive, meaning you should find the name even if the file and the user use capital letters in different places. As an extreme example, SaMueL would match SAMUel.
If your program finds the name, it should graph the data for that name. If not, it should generate a short message indicating the name was not found. See the sample execution logs at the end of this write-up. You are to reproduce this format exactly. Notice we print an error message if the name is not found, but when the name is found, we don’t print anything. Instead we draw a graph.
If the name is found, you are to construct a DrawingPanel to graph the data. Don’t construct this object until you verify that the name is in the file. If the name is not found, you should not make a DrawingPanel object. When the name is found, construct the panel and use drawing commands to produce output like the following two examples. You are to exactly reproduce this output (except the sizes below were shrunk slightly so they would fit next to each other).
Detailed specifications about the graphics:
- The panel’s overall size is 720x560 pixels.
- The background is the standard white (so you don’t have to set the background color).
- The yellow bars are at the top and bottom, 30 pixels high, and the width of the panel. This leaves a middle non-yellow area that is 500 pixels high.
- The text at the top is “Popularity rank of X per decade” where X is the name capitalized as in the data file (not necessarily what the user entered). Its x-offset is 0 and its y-offset is 16.
- The bars for decades are blue and 25 pixels wide. There is also 25 pixels of space between adjacent bars. Hence the “width of a decade” is 50 pixels and the bar is half that width.
- The text on the bottom yellow bar is the decades. All decades are always displayed.
|
Rank |
Top y |
|
1 |
30 |
|
2, 3 |
31 |
|
4, 5 |
32 |
|
6, 7 |
33 |
|
... |
... |
|
996, 997 |
528 |
|
998, 999 |
529 |
|
0 |
530 |
- The bottom of each blue bar is at the top of the bottom yellow bar. The top of each blue bar depends on the rank for that decade. See the table at the right. Notice there is a scaling factor of 2 (1 pixel for 2 ranks). If the rank is 1 or 2, the top is 30 pixels from the top of the drawing panel. For example, a ranking of 38 in 1950 results in a 25x481 rectangle occupying (250, 49) through (274, 529).
- At the same coordinate as the top-left of each blue
bar, black text shows the name's rank for that decade. For example, if the rank was 38 in 1950,
then 38 would appear at (250, 49).
- If a decade has
a rank of 0, no bar or rank number is displayed, but the decade is still
displayed.
- The font for all displayed text is 16-point, Sans Serif, bold. See below for how to set the font of a Graphics object.
Important information for displaying text using a Graphics object:
- To set the font correctly for all your text, use this
method call (assuming the variable g
refers to your Graphics
object): g.setFont(new
Font("SansSerif", Font.
You need to do this only once; the “current font” is part of the object.
- To display text, use the drawString method of the Graphics object. However, the first argument to this method is a String, so the compiler will not allow an int, as you might wish for displaying ranks and decades. The simplest way to convert an int n to the String you want is by concatenating it with the empty string: "" + n.
Constants for your program and varying number of decades:
You should introduce at least three class constants: a String with the name of the file holding the data ("names.txt"), the starting year (1900), and the space between adjacent decades (50). You may have additional constants if you wish.
If the values of the constants are changed your program should adjust accordingly:
- The starting year should be correct in the introductory message.
- The decades should begin with the starting year and increase by 10.
- The width of the decades and the bars should adjust. (Recall the bar width is half the decade width.)
Do not have a constant for the number of decades or assume a particular number (such as 11) anywhere in your program. When a name is found, read all the numbers on that line and include one decade in your graph for each number found.
Do not adjust the size of the DrawingPanel. (This could lead to extra white space on the right or to not all decades being visible, but that is okay.)
To help you test a varying number of decades, the file names2.txt has 8 decades of information for each name. A sample output for Ethel with this data and starting year 1920 is provided.
Style guidelines:
For this assignment you are limited to the language features in Chapters 1 through 6 of the textbook. In particular, do not use arrays on this assignment. Follow past stylistic guidelines about indentation, line lengths, identifier names, localizing variables, and commenting at the beginning of your program, at the start of each method, and on complex sections of code. Avoid “chaining,” which is when many methods call each other without ever returning to main. As a rough guide, our solution occupies about 90 lines and has 4 methods other than main.
Example console output:
Input is underlined and bold. The first example uses names.txt. The second uses names2.txt and has a different value for the constant holding the starting year.
This
program graphs the popularity of a name
in statistics recorded since the year 1900.
name? kumar
name not found.
This
program graphs the popularity of a name
in statistics recorded since the year 1920.
name? Ethel
Files:
Your program should be stored in a file BabyNames.java. All the other files that you need –
DrawingPanel.java, names.txt, and names2.txt are on the course web page. Put these files in the same folder as your
program.