In this project, the goal was to detect and recognize faces using Principal Component Analysis (PCA). The basic idea is that we consider faces
existing on some high dimensional plane, that forms a subspace of the space of all images. The problem is that the "high dimensions" here are very
high. Only a small amount of that information is actually very distinct, so
we can drastically reduce the dimensionality we're working with by taking only the principal components. We accomplish this by constructing a
covariance matrix from the average face and the training images, and then computing its eigenvalues and eigenvectors; throwing out all but the top
few with the highest eigenvalues. These are our "eigenfaces". Once we have these, we can represent a given face as a linear combination of the
eigenfaces added to the average face. Using this representation, we can do cool stuff like find and recognize faces.
The largest challenge was the fact that the results are expected to be imperfect. The whole thing is a bit touchy with a
lot of parameters to tweak, and it was often difficult to tell if any given change was hurting or helping the results.
findface in particular was challenging, given the mix of potential issues in the isFace/etc routines, as well as the face
locating code itself. Checking for overlaps also presented some interesting edge cases.
Writing scripts to automatically run things like findface proved very useful. Being able to check whether a change affected the
performance in a variety of test images without running it manually proved very helpful.
Also, saving debug images proved very helpful for testing in a number of places (namely in scoring for findface).

I wrote a series of ugly bash scripts to generate the eigenfaces and userbases for each number of faces, and then
used another script to run recognition for every face, at every level, and total the number of correct matches.
for i in {1..33..2}; do ./main --eigenfaces $i 25 25 ../Eigenfaces/faceImages/nonsmiling_cropped/test.txt eig/eig_$i.face; done
	for i in {1..33..2}; do
	./main --constructuserbase eig/eig_$i.face ../Eigenfaces/faceImages/nonsmiling_cropped/test.txt db/db_$i.ub; done
	for n in {1..33..2}; do
	let "k = 0";
	for i in ../Eigenfaces/faceImages/smiling_cropped/*.tga; do
		# NOTE: To make this easier, I temporarily modified the executable's output
		# to check if the image number matched the userbase name and output MATCH if so.
		let "k = $k + `./main --recognizeface $i db/db_$n.ub eig/eig_$n.face 1 | grep MATCH | wc -l`";
		done
	echo "$n, $k";
	done
I threw the results into Excel LibreOffice Calc and plotted.
Describe the trends you see in your plots. Discuss the tradeoffs; how many eigenfaces should one use? Is there a clear answer?
The first few eigenfaces increase recognition very rapidly, but after about 5, it starts to plateau, and even decrease slightly
with greater counts. This is likely because the first few are going to be the very best eigenfaces (manual inspection shows that
the 'faces' are practically noise by the 33rd face), so recognition will increase as you add the first few, but you'll get very
rapidly diminishing results. The inclusion of the less significant eigenfaces likely accounts for the dip seen in the graph,
and the improvement seen after about 20 is probably because it will slowly converge to better results when you include enough.
If you want to best overall results, 31 and 33 deliver; however there's a tradeoff in processing time required to project/construct
faces using them. Given the lack of a huge improvement, somewhere in the range of 5-10 faces is probably just fine for
many purposes (maybe more if you had more training images with more variation).
Overall, there isn't a terribly clear answer, if you want the best accuracy using a lot of faces seems to give the best results;
however, taking only the best 5-10 results seems to produce reasonable results for less processing cost.
You likely saw some recognition errors in step 3; show images of a couple. How reasonable were the mistakes? Did the correct answer at least appear highly in the sorted results?
A couple Mismatches at 10 eigenfaces:


These mistakes actually seem somewhat reasonable, in the first mismatch, there's a reasonable similarity in the eyebrows of the
two images, and in the other two both are wearing glasses.
The correct images do all appear within the top 2 or 3 in all of these cases, however.
I ran findface on a variety of images, see descriptions of each photo for details.
I address the questions as necessary for each sample image below.

./main --findface elf.tga eig/eig_10.face 0.45 0.55 0.01 crop 1 cropped_elf.tga
The above result shows the cropped elf.tga test image. I used the provided scale values.


./main --findface test_me.tga eig/eig_10.face 0.1 0.2 0.01 mark 1 marked_me.tga
The above results is a photo of me, detected sucessfully by the tool. I guesstimated and set the scale
very low, since my face took up most of the photo, and this resulted in satisfactory results.

./main --findface class_pano_handheld.tga eig/eig_10.face 0.1 0.3 0.01 mark 35 marked_class.tga
The above results is a photo of the class marked by the tool (since the detection rectangles are small, click
for the full image...). This one was done with a narrow range of scales (guessed based on the relative sizes of the
faces), and resulted in fewer false positives than the same image with a bigger range (see below).
It recognized 26 of the people in the photo. False positives seemed to favor foreheads, which seems to make sense
(it looks like peoples' harlines are similar enough to eyes/eyebrows to fool it sometimes).
It also favored peoples' pants, which I suppose makes some sense (fairly low-variance, with random wrinkles being potentially
mistaken for facial features).

./main --findface class_pano_handheld.tga eig/eig_10.face 0.15 0.75 0.01 mark 35 marked_class_scale.tga
The above results is a photo of the class marked by the tool (since the detection rectangles are small, click
for the full image...).
I used a fairly large range of scales, from 0.15-0.75 at a low granularity of 0.01 (this took a while to run).
It only completely correctly identified 7 of the people in the photo. Most of the false positives were for the same reasons as
I discussed above (hairlines resembling eyes/eyebrows, and pants/clothing being detected).


./main --findface test.tga eig/eig_10.face 0.1 0.2 0.01 mark 6 marked_test.tga
The above result is a random photo I grabbed off Facebook. I picked my scale to be fairly small, since the image was fairly close up to the faces and getting the 25x25 window to fit well would take a good deal of shrinking.
It failed to recognize two people. They both have their heads tilted somewhat, and since the algorithm makes no attempt to be invariant to rotation, this is understandable. The person in the middle is also wearing fairly thick glasses, which weren't too well represented in the training set.
It's also notable that the false positives were on a red shirt; the fact that I weight the sampled color channels such that red is
slightly preferred, this may be a factor here.

./main --findface group_neutral.tga eig/eig_10.face 0.6 0.8 0.01 mark 3 marked_group.tga
The above is one of the group neutral photos, it identified all three successfully. I guesstimated a scale range of 0.6-0.8.
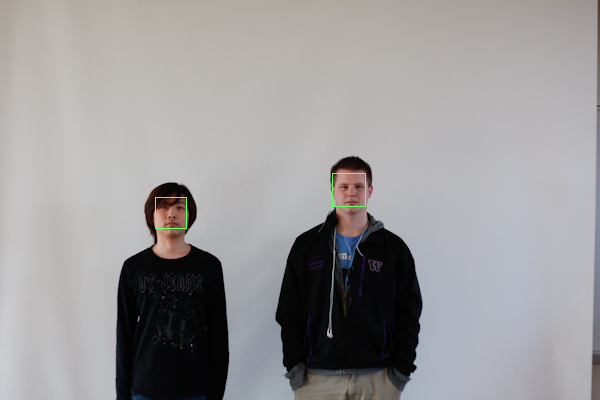
./main --findface group_neutral_1.tga eig/eig_10.face 0.6 0.8 0.01 mark 2 marked_group_1.tga
The above is the group1 photo, it identified both students. I guesstimated the scale range of 0.6-0.8.

I wrote a bash script to iterate through all of the faces at various MSE's from 5,000 to 200,000 in steps of 5,000. For each faces
at each MSE, I compared it with the smiling version, and with the smiling version of another student. I then plotted the results, as
seen above.
for MSE in {5000..200000..5000}; do
	let "matches = 0";
	let "false_matches = 0";
	for n in {1..33..1}; do
		let "matches = matches + `./main --verifyface ../Eigenfaces/faceImages/smiling_cropped/smiling-$n.tga db/db_6.ub /home/riley/Desktop/Eigenfaces/faceImages/nonsmiling_cropped/neutral-$n eig/eig_6.face "$MSE" | grep "is a picture of" | wc -l`";
		# just compare against an arbitrary face (#6, or #4 if we're at #6)
		if [ "$n" -eq "6" ]
		then
			let "false_matches = false_matches + `./main --verifyface ../Eigenfaces/faceImages/smiling_cropped/smiling-4.tga db/db_6.ub /home/riley/Desktop/Eigenfaces/faceImages/nonsmiling_cropped/neutral-$n eig/eig_6.face "$MSE" | grep "is a picture of" | wc -l`";
		else
			let "false_matches = false_matches + `./main --verifyface ../Eigenfaces/faceImages/smiling_cropped/smiling-6.tga db/db_6.ub /home/riley/Desktop/Eigenfaces/faceImages/nonsmiling_cropped/neutral-$n eig/eig_6.face "$MSE" | grep "is a picture of" | wc -l`";
		fi
	done
	echo "$MSE, $matches, $false_matches";
done
What MSE thresholds did you try? Which one worked best? What search method did you use to find it?
I ran a script and tried all the MSEs from 5000 to 200000, at 5000 granularity. A little over 100,000 seemed to
be about the best, with 29/33 detections and just a single false positive. I found this by running the script and
examining the result plot.
Using the best MSE threshold, what was the false negative rate? What was the false positive rate?
As discussed above, at the best MSE, I had 29/33 true positives (4 false negatives) and 1 false positive.


