CSE576 Project 3 Face Recognition
Cameron Lee
Recognition with Cropped Class Images
Average Face

Figure 1 Average face
Eigen Faces


Figure 2 Principal Components 0-4 top row left to right, 5-9 bottom row left to right
Recognition of Cropped Smiling Faces
Table 1 Recognition with Respect to Eigen Vector Dimensions
|
Eigen
Vectors |
1 |
3 |
5 |
7 |
9 |
11 |
13 |
15 |
17 |
19 |
21 |
|
face 1 |
0 |
0 |
0 |
0 |
0 |
0 |
0 |
0 |
0 |
0 |
0 |
|
face 2 |
0 |
0 |
0 |
0 |
0 |
0 |
0 |
0 |
0 |
0 |
0 |
|
face 3 |
1 |
1 |
1 |
1 |
1 |
1 |
1 |
1 |
1 |
1 |
1 |
|
face 4 |
0 |
0 |
1 |
1 |
1 |
1 |
1 |
1 |
1 |
1 |
1 |
|
face 5 |
0 |
0 |
0 |
0 |
0 |
0 |
0 |
0 |
0 |
0 |
0 |
|
face 6 |
0 |
0 |
1 |
1 |
1 |
1 |
1 |
1 |
1 |
1 |
1 |
|
face 7 |
1 |
0 |
0 |
0 |
0 |
0 |
0 |
0 |
0 |
0 |
0 |
|
face 8 |
0 |
0 |
1 |
1 |
0 |
1 |
1 |
1 |
1 |
1 |
1 |
|
face 9 |
0 |
0 |
0 |
0 |
0 |
0 |
0 |
0 |
0 |
1 |
1 |
|
face 10 |
1 |
1 |
1 |
0 |
0 |
1 |
1 |
1 |
1 |
1 |
1 |
|
face 11 |
0 |
0 |
0 |
0 |
0 |
0 |
0 |
0 |
0 |
0 |
0 |
|
face 12 |
1 |
0 |
0 |
0 |
0 |
0 |
1 |
1 |
1 |
1 |
1 |
|
face 13 |
0 |
0 |
0 |
0 |
1 |
1 |
0 |
0 |
0 |
0 |
1 |
|
face 14 |
0 |
0 |
0 |
0 |
0 |
0 |
0 |
0 |
0 |
0 |
0 |
|
face 15 |
0 |
0 |
0 |
0 |
0 |
0 |
0 |
1 |
1 |
1 |
1 |
|
face 16 |
0 |
1 |
1 |
1 |
1 |
1 |
1 |
1 |
1 |
1 |
1 |
|
face 17 |
0 |
0 |
0 |
0 |
0 |
0 |
0 |
0 |
0 |
0 |
0 |
|
face 18 |
0 |
1 |
1 |
1 |
1 |
1 |
1 |
1 |
1 |
1 |
1 |
|
face 19 |
0 |
1 |
1 |
1 |
1 |
1 |
1 |
1 |
1 |
1 |
1 |
|
face 20 |
0 |
0 |
0 |
0 |
0 |
1 |
1 |
1 |
1 |
1 |
1 |
|
face 21 |
0 |
1 |
1 |
0 |
1 |
1 |
1 |
1 |
1 |
1 |
1 |
|
Correct |
4 |
6 |
9 |
7 |
8 |
11 |
11 |
12 |
12 |
13 |
14 |

Figure 3
Discussion
The Data suggests that the larger the data set and more components you use to describe Face Space the better the recognitions. This seems like simple answer to the question, “how many principal components should I use?”, however, computation time and diminishing result may reduce the number used in practice.
One noticeable trend is that some faces are not easy recognizable and some are very easy to recognize. This may be because the emotional state alters the face significantly and the training set is unable to accurately reconstruct these cases. The other trend was faces that could be recognized with a lower number principal components could typically be recognized with more components.
In the higher dimension cases errors were fairly reasonable,
except for a few cases where people had contorted faces; the correct match was
near the top of the list. In the lower
order cases recognition was not good; often times the true match would be in
the lower third of the list.
Cropping and Finding Faces
Cropped Image from Elf.tga


Figure 4 cropped from
“elf.tga” min_scale = 0.45 max_scale=0.55 and
step = 0.01
Digital Photograph of Myself Back in the Day


Figure 5 cropped from “” with min_scale =0.07 max_scale =0.09 and step = 0.001
Digital Photograph of People in Class
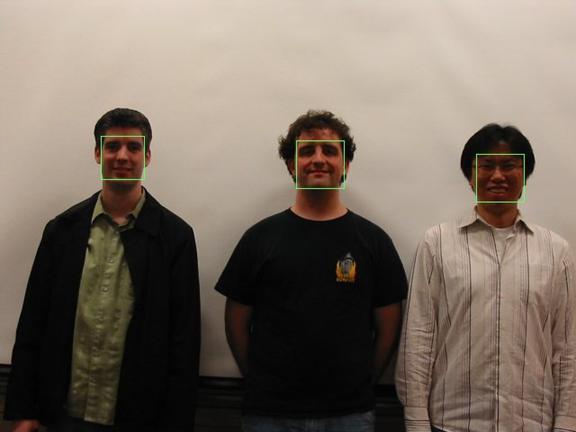
Figure 6 marked “gropu1.tga” min_scale = 0.4 max_scale = 0.5 step = 0.01 mark = 3
Pentax Engineering Team
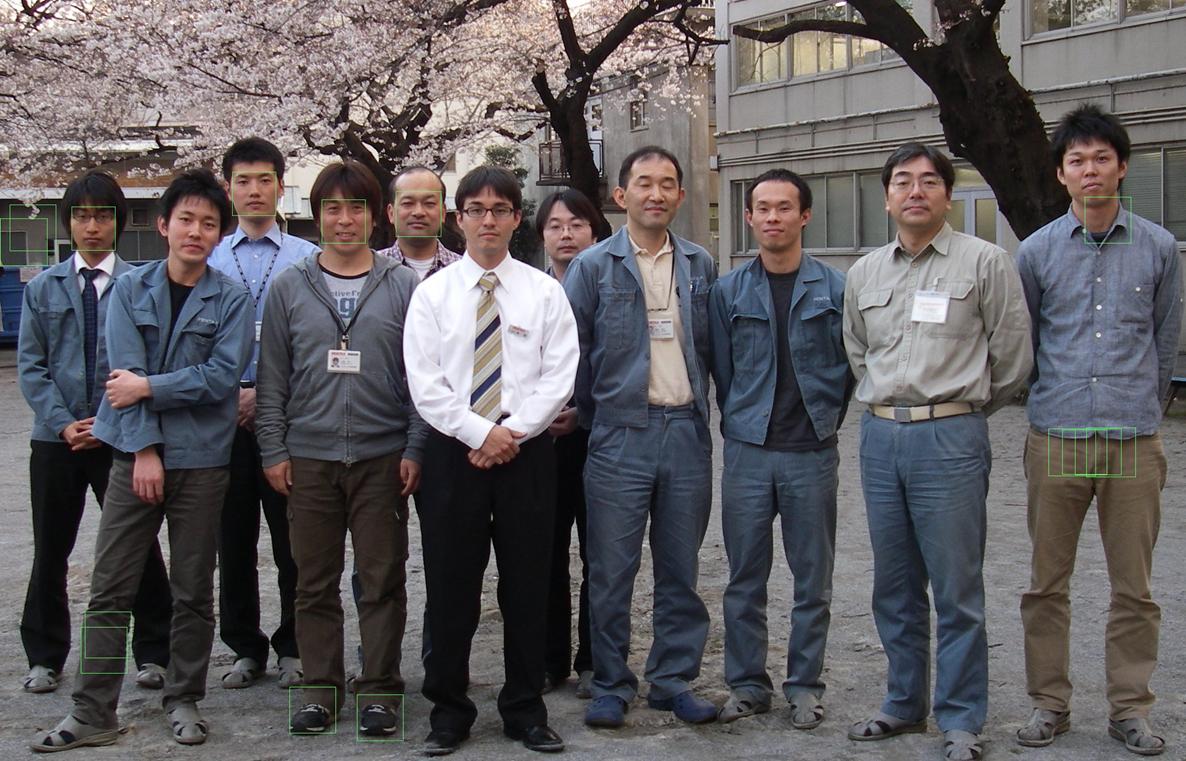
“personal.tga”
Discussion
The difficult part of finding faces in images was overcoming
false positive results. Often areas of
low contrast resulted in positive matches.
Color cues were used by limiting the range of