Computer Vision (CSE576), Spring 2008

Project 3: Eigenfaces

Rahul Garg


Average Face and Eigen Faces


One does not see very interesting patterns in the above eigen faces except that the first eigen face is probably representative of the skin complexion.  This could be because of the fact that the database was very small.

Plot of classification accuracy vs number of eigenfaces


The accuracy goes up (on average) as we increase the number of eigen faces. However, these results may not be reliablle because of the small size of the database. Ideally, we would not like to use too many eigen faces as that could 'overfit' the training data. From above plot, using 7-8 eigenfaces seems reasonable.

A couple of misclassification are shown below:

Input Image Nearest Image found Ground Truth

However, the correct match often appeared as one of the top results. For instance, when using 10 eigenfaces, the correct match was in top 3 results in 4 of the 11 misclassifications.

Cropping and finding faces

The error metric I used was the MSE of the reconstruction from the original divided the standard deviation of the patch.

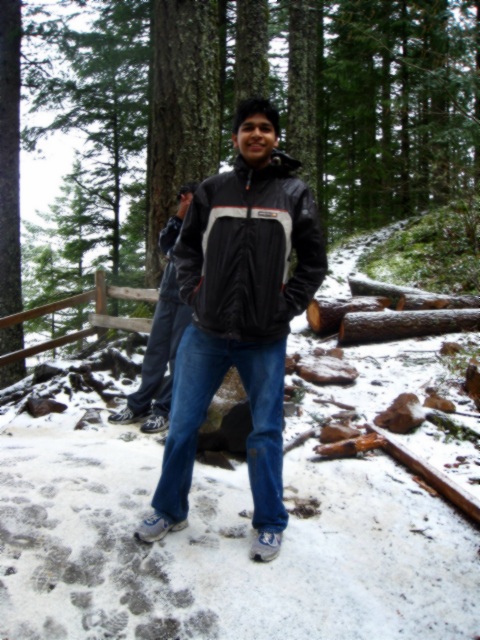
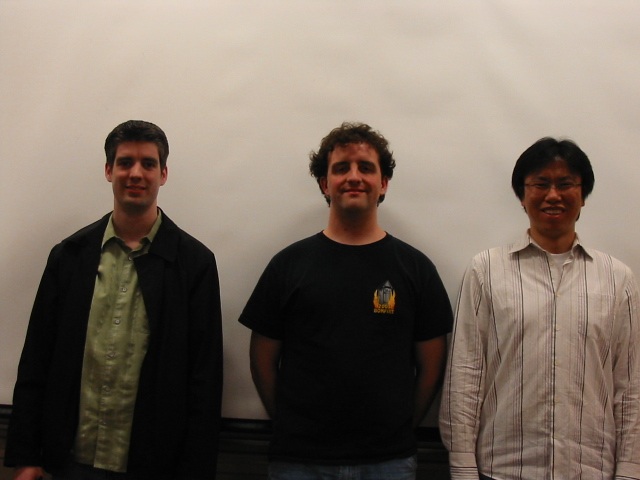
Extracting a single face from the image on the left:
main.exe --findface 00002.tga eig.face 0.45 0.55 0.05 crop 1 cropped.tga
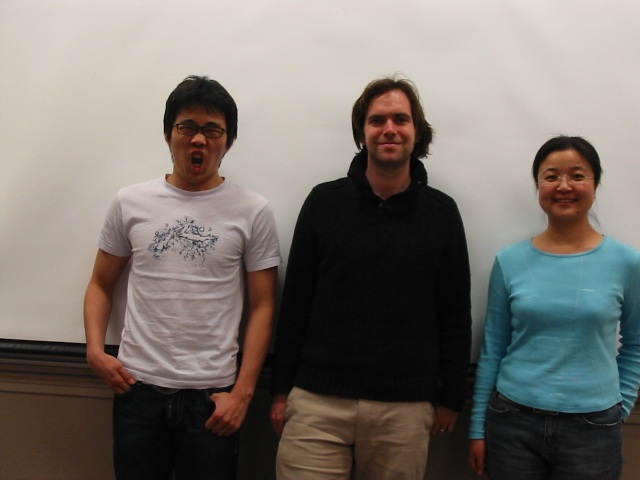
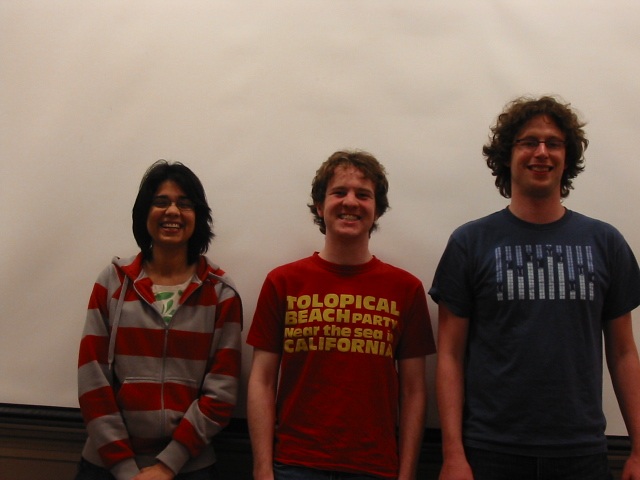
main.exe --findface img.tga eig.face 0.75 0.85 0.02 crop 1 cropped.tga:


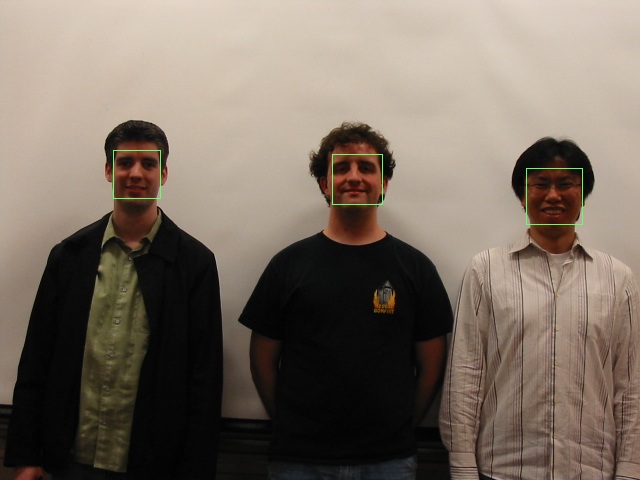
main.exe --findface img.tga eig.face 0.45 0.55 0.01 mark  3 cropped.tga:
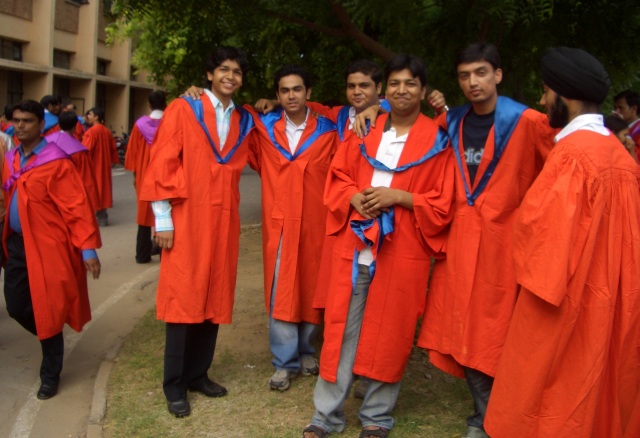
main.exe --findface img.tga eig.face 0.95 1.05 0.01 mark  5 cropped.tga:

Although the performance was really good on the group photos of the class it could not find all the faces in the last image (and it is one of the better results among the ones I tried). Though one can argue that the two undetected faces are slightly tilted but I believe more training data is required to build a reliable face detector. Generally, I didn't give too large a scale space to search over primarily because the detector was really slow. I also found that using a coarser step size of 0.05 in scale space performed decently. Also, its geenrally hard to reason about the misclassification because visually they dont look like a face in most cases.

Verify Face

Following plot shows how the difference of true positive rate and false positive rate varies with threshold.


Looking at the plot, a threshold value of 190000 seems a reasonable choice. The  false negative rate at this threshold was 5/21 while the false positive rate was 1/21.  But this is a very small database to make any reliable conclusions.

Extra Credit