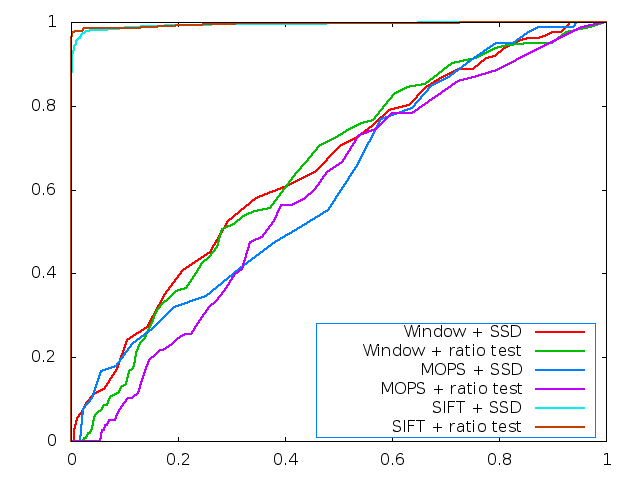
Figure 1: ROC curve for Yosemite dataset
I modeled my feature descriptor after MOPS, although I haven’t implemented all of the features. After each Harris feature is detected, I take a 16x16 or 32x32 window of points around each feature and create a Gaussian pyramid, downsampling to 8x8. After normalizing these 64 points to zero mean and unit variance, they become the feature descriptor. This is the MOPS descriptor without orientation correction.
The first change I made was adding intensity correction to the basic 25x25 window. This marginally improved the ROC curves for both test sets (Yosemite and graffiti), but not enough! I added pyramids, and found that performance improved. 16x16 downsampled once performs better on the Graffiti dataset, 32x32 downsampled twice performs better on the Yosemite dataset.
My algorithm handles translations and intensity/exposure well, but can’t handle rotations.
I made my feature contrast invariant by rescaling all features for zero mean and unit variance. I also implemented image periods for slight performance increase.