CSE
576 Computer Vision
Project 1:
Feature Detection and Matching
Name: Kuan-Hui Lee
Introduction
In
this project, I implement Harris corner detection and Multi-Scale Oriented
Patches (MOPS) descriptor [1]
to detect discriminating features in an image and find the best matching
features in other images. I use MOPS descriptor because it is not only
scale invariant but also orientation invariant. The reason why MOPS is scale
invariant is that MOPS utilizes Gaussian of pyramid to describe the feature,
and the reason why MOPS is orientation invariant is that MOPS consider the
orientation of the interest points by rotating to the dominant orientation. In
the experiments, I evaluate the performance of MOPS descriptor and simple
square window descriptor on a suite of benchmark images, and compare them with
the state-of-art feature descriptor (SIFT) [2].
Multi-Scale
Oriented Patches (MOPS) Feature Descriptor
Multi-Scale
Oriented Patches (MOPS) are a minimalist design for local invariant features.
They consist of a simple bias-gain normalized patch, sampled at a coarse scale
relative to the interest point detection. The low frequency sampling helps to
give insensitivity to noise in the interest point position. The interest points
I use are multi-scale Harris corners. For each input image ![]() ,
a Gaussian image
,
a Gaussian image ![]() pyramid is formed, using a subsampling
rate s = 2 and pyramid smoothing
width σp = 1.0. Interest points are
extracted from each level of the pyramid. First, the image is transferred to
gray level, and then Gaussian pyramid is built with different octaves. The blurred images are used for the next (higher)
octave to create the blurred images, and so forth. The idea is shown in the Figure
1.
pyramid is formed, using a subsampling
rate s = 2 and pyramid smoothing
width σp = 1.0. Interest points are
extracted from each level of the pyramid. First, the image is transferred to
gray level, and then Gaussian pyramid is built with different octaves. The blurred images are used for the next (higher)
octave to create the blurred images, and so forth. The idea is shown in the Figure
1.

Figure 1
The
Harris matrix at level l and position (x, y) is the smoothed outer product of
the gradients
![]()
We
set the integration scale ![]() and the derivative scale
and the derivative scale
![]() .
To find interest points, we first
compute the “corner strength” function:
.
To find interest points, we first
compute the “corner strength” function:

which
is the harmonic mean of the eigenvalues ![]() of H. Interest points are located where
the corner strength
of H. Interest points are located where
the corner strength ![]() is a local maximum in a 3 × 3
neighborhood, and above a threshold t = 10.0. Once local-maxima have been
detected, their position is refined to sub-pixel
accuracy by fitting a 2D quadratic to the corner
strength function in the local 3×3 neighborhood and finding
its maximum. For each interest point, we also compute an orientation θ, where
the orientation vector [cosθ,
sinθ] = u/|u|
comes from the smoothed local gradient
is a local maximum in a 3 × 3
neighborhood, and above a threshold t = 10.0. Once local-maxima have been
detected, their position is refined to sub-pixel
accuracy by fitting a 2D quadratic to the corner
strength function in the local 3×3 neighborhood and finding
its maximum. For each interest point, we also compute an orientation θ, where
the orientation vector [cosθ,
sinθ] = u/|u|
comes from the smoothed local gradient
![]()
The
integration scale for orientation is ![]() .
A large derivative scale is desirable so that the gradient field
.
A large derivative scale is desirable so that the gradient field
![]() varies smoothly across the image, making
orientation estimation robust to errors in interest point location.
varies smoothly across the image, making
orientation estimation robust to errors in interest point location.
After
detecting the interest points, I need to extract a description of the local
image structure that will support reliable and efficient
matching of features across images. Given an oriented interest point (x, y,
l, θ), I sample a 9 × 9 patch of pixels around the sub-pixel location
of the interest point, using a spacing of s
= 5 pixels between samples (Figure
2). To avoid aliasing, the sampling is performed at a
higher pyramid level, such that the sampling rate is approximately once per
pixel (the Nyquist frequency). After sampling, the
descriptor vector is normalized so that the mean is 0 and the standard
deviation is 1. This makes the features invariant to affine
changes in intensity (bias and gain). Finally, we extract the 9 × 9 descriptor
patch di
to form a 81 dimensional descriptor vector, from the
Gaussian pyramid.

Figure 2
Experimental
Results
There are 3 experiments in the project.
First experiment tests two testing datasets, graf and Yosemeti, second experiments
tests benchmark testing datasets: bikes,
graf, leuven,
and wall, and the third experiment
tests other datasets: beaver, predator, and house. The feature type of Harris corner for executable is 2, and
the MOPS is 3.
ROC
datasets
In the first experiment, I use
Harris corner detection to detect the interested points, and then use simple
square window as the descriptor. Then, I use Multi-Scale Oriented Patches
(MOPS) as the descriptor. Besides, I also use Scale-invariant
feature transform (SIFT) descriptor as the comparison. Each
descriptor is applied two kinds of matching scheme: SSD matching and ratio test
matching. The ROC curves with different settings are shown as Figure
3,
and the AUC values are shown in the Table
I.
As we can see in the Figure
3
and Table
I,
the results of the MOPS are better than the simple square window, especially by
using ratio test matching. In the Yosemeti testing
set, the AUC results of the MOPS are much better than square window descriptor.
This is because Yosemeti testing set only has a
translation between the images. The matched images are shown beside the ROC
curves; here I just show the results with MOPS feature matched by ratio
matching.


Figure 3
|
|
graf (1to2) |
graf (1to4) |
Yosemeti (1to2) |
|
square
window+SSD |
0.616209 |
0.603844 |
0.841205 |
|
square
window+ratio |
0.572349 |
0.614171 |
0.881062 |
|
MOPS+SSD |
0.635616 |
0.560175 |
0.965544 |
|
MOPS+ratio |
0.636376 |
0.556795 |
0.976857 |
|
SIFT+SSD |
0.932023 |
0.631943 |
0.994692 |
|
SIFT+ratio |
0.964775 |
0.662414 |
0.998442 |
Table I
Benchmark
datasets
In the second experiment, I test
datasets in the benchmark. There are 4 datasets in the testing benchmark: bikes, graf, leuven,
and wall. Here I compare two
descriptors: simple square window and MOPS, with both SSD and ratio test
matching scheme. Table
II
shows the average error and AUC value of the datasets in SSD matching scheme,
while Table
III
shows the average error and AUC value of the datasets in ratio matching scheme.
As shown in the tables, MOPS descriptor has better results than the square
window ones, and ratio matching performs better than SSD matching.
|
SSD
matching |
bikes |
graf |
leuven |
wall |
|
|
Square
window |
Avg
error (pixel) |
351.518998 |
298.458099 |
267.831739 |
315.500524 |
|
AUC |
0.274419 |
0.539099 |
0.510582 |
0.539968 |
|
|
MOPS |
Avg
error (pixel) |
292.039042 |
294.667663 |
225.386793 |
317.429353 |
|
AUC |
0.836322 |
0.565938 |
0.821942 |
0.832833 |
|
Table II
|
Ratio
matching |
bikes |
graf |
leuven |
wall |
|
|
Square
window |
Avg
error (pixel) |
355.837239 |
268.734670 |
279.868046 |
324.845142 |
|
AUC |
0.318105 |
0.583318 |
0.581805 |
0.564149 |
|
|
MOPS |
Avg
error (pixel) |
309.44252 |
280.091299 |
253.596348 |
340.733291 |
|
AUC |
0.893496 |
0.598450 |
0.883778 |
0.807800 |
|
Table III

bikes

leuven


wall
Figure 4
Figure
4 shows the MOPS matched results and ROC curves. As we
can see, MOPS descriptor performs well than simple square window descriptor. In
the case of bikes, the features still can be matched even if the images are
blurred. This is because the characteristics of the Gaussian pyramid. In the
case of leuven, MOPS descriptor
still performs well when intensities become low. In the case of wall, MOPS’s
performance is good enough when compared to the SIFT.
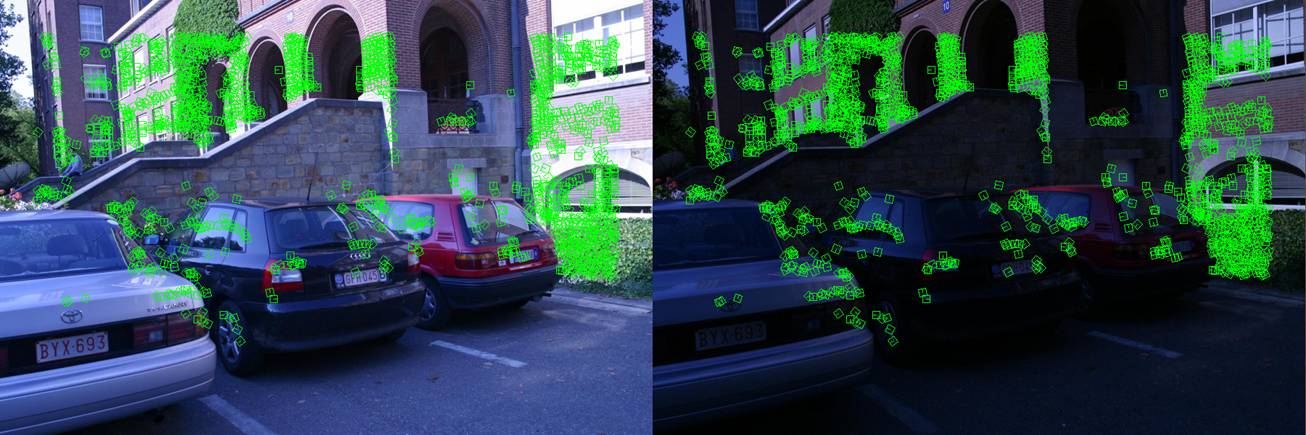
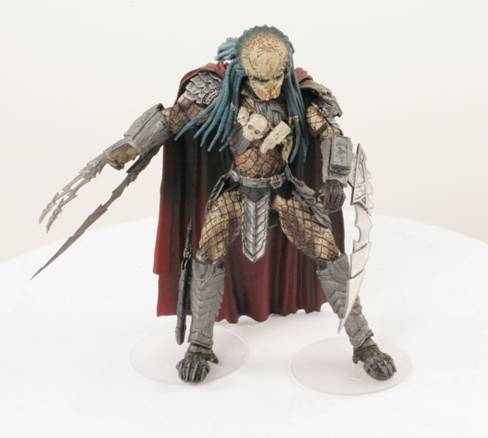
My
datasets
In the third experiment, I test 3
of other datasets: beaver, predator, and house. The beaver dataset test the ability of the scale issues,
while the predator dataset tests the rotational issues. The homography
matrix between the images in each pair is constructed by SIFT features. The
images and the experimental results, including ROC curves and AUC values are
shown in the Figure
5
and Table
IV,
separately. As shown in the figures, the MOPS descriptor performs better
results and achiever higher AUC values in the testing datasets.


beaver


(cannot show
the matched result due to image size is too large to catch)
predator


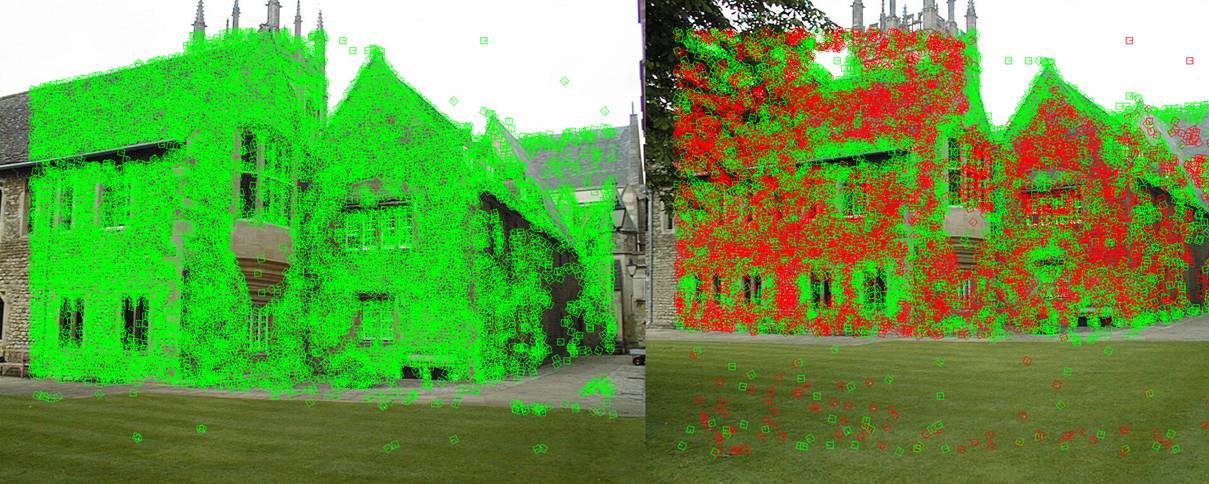

house
Figure 5
|
|
beaver |
predator |
House |
|
square
window+SSD |
0.581502 |
0.498501 |
0.455505 |
|
square
window+ratio |
0.741565 |
0.504360 |
0.479408 |
|
MOPS+SSD |
0.668211 |
0.703020 |
0.647480 |
|
MOPS+ratio |
0.782887 |
0.665649 |
0.621202 |
Table IV
Conclusion
In this project, I implement Harris
corner detection and Multi-Scale Oriented Patches (MOPS) descriptor to detect
discriminating features in an image and find the best matching features in
other images. The performance is quite good when compared to the simple square
window descriptor. Because of considering the Gaussian pyramid and orientation,
it performs much better especially when scale and orientation issues happen.
However, the performance cannot achieve that of SIFT descriptor, because SIFT
descriptor also considers the orientation of the gradient.
Reference
[1] M.
Brown, R. Szeliski and S.
Winder, “Multi-image matching using multi-scale oriented
patches,” International Conference on Computer Vision and Pattern Recognition,
pp. 510-517.
[2] David
G. Lowe, "Distinctive image features from scale-invariant keypoints," International
Journal of Computer Vision, 60, 2, pp. 91-110, 2004.