 |
Alec Wolman, Geoff Voelker, Nitin Sharma, Neal Cardwell, Molly Brown,
Tashana Landray, Denise Pinnel, Anna Karlin, Henry Levy
Department of Computer Science and Engineering
University of Washington
Performance-enhancing mechanisms in the World Wide Web primarily exploit repeated requests to Web documents by multiple clients. However, little is known about patterns of shared document access, particularly from diverse client populations. The principal goal of this paper is to examine the sharing of Web documents from an organizational point of view. An organizational analysis of sharing is important, because caching is often performed on an organizational basis; i.e., proxies are typically placed in front of large and small companies, universities, departments, and so on. Unfortunately, simultaneous multi-organizational traces do not currently exist and are difficult to obtain in practice.
The goal of this paper is to explore the extent of document sharing (1) among clients within single organizations, and (2) among clients across different organizations. To perform the study, we use a large university as a model of a diverse collection of organizations. Within our university, we have traced all external Web requests and responses, anonymizing the data but preserving organizational membership information. This permits us to analyze both inter- and intra-organization document sharing and to test whether organization membership is significant. As well, we characterize a number of parameters of our data, including basic object characteristics, object cacheability, and server distributions.
The need to understand Web behavior and performance has led to a large number of studies, aimed in particular at classifying Web document characteristics [11,12,13,16,21]. In contrast, the principal goal of this study is to evaluate document sharing behavior on the Web, both within organizations and between organizations. By document sharing, we mean access to the same Web documents by different clients. Sharing behavior has obvious implications for performance, particularly with respect to the effectiveness of proxy caching (e.g., [9,14,17,20,27]). Proxy caches are often located at organizational boundaries and improve performance only if many documents are shared by many clients. Therefore, an understanding of sharing gives us added insight into potential performance-enhancing mechanisms and alternative caching structures.
An analysis of document sharing within an organization is straightforward and can help predict the benefits of an organizational proxy cache [13]. Studying sharing across multiple organizations is much more difficult, however. Tracing of the entire Web is obviously not achievable, but even simultaneous traces of multiple organizations do not currently exist. In addition, the requirement of most organizations for anonymization of URLs and IP addresses, along with the different dates of data capture, makes correlation of separate traces challenging, if not impossible.
In this study, we use The University of Washington (UW) as a basis for modeling intra- and inter-organizational Web-object sharing. The UW is the largest university in the northwest part of the U.S., with a population of over 50,000 people, including 35,000 students, 10,000 full-time staff, and 5,000 faculty. The university has a large communications infrastructure, consisting of thousands of computers connected via both high-speed networks and modems. Together, this community generates a workload of about 17,400 university-external Web requests per minute at peak periods.
As with other universities, UW is organized into many colleges, departments, and programs, each with its own disparate administrative, academic, or research focus. For example, the UW includes museums of art and natural history, medical and dental schools, libraries, administrative organizations, and of course academic departments, such as music, Scandinavian languages, and computer science. What do such diverse organizations have in common with respect to their Web access requests? To answer this question, we have traced all UW-external Web requests; we anonymize the data in such a way as to identify requests (and associated responses) with the 170 or so independent organizations from which they were issued. This permits us to study organization-specific document access and sharing behavior. We have collected a number of traces during the period from October 1998 through the present. In general, all of our traces show the same basic patterns. The results in this paper are based on a representative one-week trace taken in mid-May 1999, and therefore show the very latest characteristics of modern Web traffic.
The paper is organized as follows. The next section provides a brief description of related work. In Section 3 we describe our trace-capture methodology. Section 4 contains a high-level description of the workload we traced. Section 5 focuses on organization-based statistics and also provides inter- and intra-organization sharing analysis. In Section 6 we discuss cacheability of documents, and reasons why documents are not cacheable. Finally, Section 7 summarizes our study and its results.
Numerous recent studies of Web traffic have been performed. These studies include analyses of Web access traces from the perspective of browsers [11,21], proxies [2,4,6,10,12,15,18,19,24], and servers [1,3,23]. The earlier tracing studies were rather limited in request rate, number of requests, and diversity of population. The most recent tracing studies have been larger and generally more diverse. In addition to static analysis, some studies have also used trace-driven cache simulation to characterize the locality and sharing properties of these very large traces [2,5,13,15,16,19], and to study the effects of cookies, aborted connections, and persistent connections on the performance of proxy caching [5,15].
In this paper, we expand on these previous research efforts. Our focus is on sharing and cacheability; however we can also compare our current HTTP traffic characteristics to earlier studies, showing how the Web workload has changed. Our work is based on the most recent data from a large diverse population. More important, we preserve enough information so that we can analyze requests with respect to inter-organization and intra-organization document sharing.
We use passive network monitoring to collect our traces of Web traffic traveling between the University of Washington and the rest of the Internet. UW connects to its Internet Service Providers via two border routers; one router handles primarily outbound traffic and the other inbound traffic. These two routers are fully connected to four 100-megabit Ethernet switches distributed across the campus. Each switch has a monitoring port that is used to send copies of the incoming and outgoing packets to our monitoring host, which analyzes the packets and produces a trace.
We designed and implemented the tracing software used to produce that data in this study. Our user-level tracing software runs on a 500 MHz Digital Alpha 21164 workstation running Digital Unix V4.0. This software installs a kernel packet filter [22] to deliver all TCP packets from the network interfaces to the user-level monitoring process, which analyzes the packets and produces a trace. The user-level process consists of three layers: TCP segment analysis, HTTP header processing, and logging. The TCP segment analysis layer classifies individual TCP packets into TCP connections and identifies the first data segments in each connection. The first data segment is used to decide whether or not the connection is an HTTP connection. This technique allows us to see all HTTP traffic (not just port 80). Once a connection has been classified as an HTTP connection, we monitor further segments on that connection so that we can locate all the relevant HTTP headers when persistent connections are in use. The HTTP header processing layer is responsible for parsing the HTTP headers extracted from TCP data segments in the HTTP connection. Once the headers have been parsed, we extract the fields to be saved and anonymize those fields that contain sensitive information. We also anonymize the IP addresses here, and then pass that information to the logging layer. The logging layer takes the information from the HTTP parser, converts it to a compact binary representation, compresses it, and writes it to disk. We maintain packet loss counters on the monitoring host at the device driver level, at the packet filter level, and at user level. During the May trace, we measured the packet loss at .0007%. It is also possible for the switches to drop packets, and we cannot detect packet loss at the these switches, but the UW network administrators who manage the switches tell us that they have significant excess capacity.
We use an anonymization approach that protects privacy but preserves some address locality information. For internal addresses, we classify the IP address based on its ``organization'' membership. An organization is a set of university IP addresses that forms an administrative entity; an organization may include multiple subnets. For instance, all machines in the Computer Science Department are in a single organization, machines in the Department of Dentistry are in another, and machines connected to the campus Museum of Natural History are in yet another. We constructed the mapping from subnets to organization identifiers based on information obtained from the campus network administrators. Once the organization identifiers are assigned, both the IP address and the organization identifier are anonymized. Furthermore, some bits of information in the IP address are destroyed before anonymization to make the anonymization more secure. If the hash function or key is compromised, no transaction can be associated with a client address with absolute certainty.
For external addresses, we anonymize each octet of the server IP address separately. For our purposes, two servers are near each other if they share most or all of the Internet path between them and the university. We consider two servers to be on the same subnet when the first three octets of their IP addresses match. Given the use of classless routing in the Internet, this scheme will not provide 100% accuracy, but for large organizations we expect that this assumption will be overly conservative rather than overly aggressive.
Although our tracing software records all HTTP requests and responses flowing both in and out of UW, the data presented in this paper is filtered to only look at HTTP requests generated by clients inside UW, and the corresponding HTTP responses generated by servers outside of UW. All of our results are based on the entire trace collected from Friday May 7th through Friday May 14th, 1999, except for the organization-based sharing results in Section 5, which are from a single day (Tuesday) of our trace (the limitation is due to the memory requirements of the sharing analysis).
Table 1 shows the basic data characteristics. As the table shows, our trace software saw the transfer of 677 gigabytes of data in response packets, requested from about 23,000 client addresses, and returned from 244,000 servers. It is interesting that, compared to the commonly-used 1996 DEC trace (analyzed, e.g., in [13]), which had a similar client population, we saw four times as many requests in one week as DEC saw in 3 weeks. These requests and corresponding response and close events follow the typical diurnal cycle, with a minimum of 460 requests per minute (at 5 AM) and a peak of 17,400 requests per minute (at 3 PM).
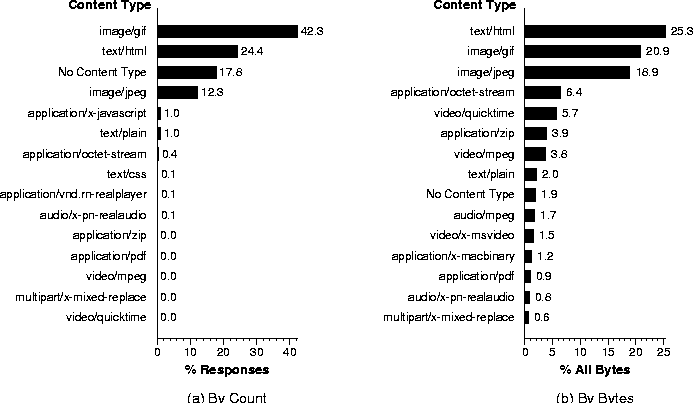
Figures 1a and 1b present a histogram of the top content types by object count and bytes transmitted, respectively. By count, the top four are image/gif, text/html, No Content Type, and image/jpeg, with all the rest of the content types at significantly lower numbers. The No Content Type traffic, which accounts for 18% of the responses, consists primarily of short control messages. The largest percentage of bytes transferred is accounted for by text/html with 25%, though the sum of the image/gif (19%) and image/jpeg (21%) types accounts for 40% of the bytes transferred. The remaining content types account for decreasing numbers of bytes with a heavy-tailed distribution.
|
Another type that accounts for significant traffic, which is not readily apparent from the table, is multimedia content (audio and video). The sum of all 59 different audio and video content types that we observed during the May trace adds up to 14% of all bytes transferred. In addition, there is a significant amount of streaming multimedia content that is delivered through an out-of-band channel between the audio/video player and the server.
In a preliminary attempt to view some of this out-of-band multimedia traffic, we extended our tracing software to analyze connections made by the Real Networks audio/video player, examining port 7070 traffic. Newer versions of the Real Networks player use the RTSP protocol, which we do not handle. The Real Networks player sets up a TCP control connection on port 7070, and then transfers the data on UDP port 7070. Our trace software only collects TCP segments, so we analyze the control connection to determine how much data is being transferred. When the control connection is shut down, a ``statistics'' packet is transmitted that contains the average bandwidth delivered (in bits per second) as measured by the client for the completed connection. We take that that bit-rate and multiply it by the connection duration time to estimate the size of the content transferred. Some of the control connections do not transmit the statistics packet, in which case we cannot make an estimate.
During the week of the May trace, we observed 55000 connections, of which approximately 40% had statistics packets. For those 40%, we calculated that 28 GB of Real-Audio and Real-Video data were transferred (which would scale to 10% of the amount of HTTP data transferred if the other 60% of connections have similar characteristics). Furthermore, the Real-Audio and Real-Video objects themselves are quite large, with an average size of just under a megabyte. When we sum up all the different kinds of multimedia content, we see that from 18% to 24% of Web related traffic coming in to the University is multimedia content, and this is a lower bound since we know that we're missing RTSP traffic at the very least. We believe that the large quantity of audio and video is signaling a new trend; e.g., in the data collected for studies reported in [12] and [16], audio traffic does not appear.
We also examined the distribution of object sizes for HTTP objects transmitted. We observe here once again the usual heavy-tailed phenomenon that has been observed for object size distributions in all previous studies. In our trace, we found a mean object size of X.X KB, with a median of less than X KB. These numbers are fairly consistent with those measured in earlier traces, e.g., [21,16].
We were also curious about the HTTP protocol versions currently in use. The majority of requests in our trace (53%) are made using HTTP 1.0, but the majority of responses use HTTP 1.1 (69%). In terms of bytes transferred, the majority of bytes (75%) are returned from HTTP 1.1 servers.
These statistics simply serve to provide some background about the general nature of the trace data, in order to set the context for the analysis in the next two sections.
This section presents and analyzes our trace data, focusing on document sharing. As previously stated, our intention is to use the university organizations as a simple model of independent organizations in the Internet. Our goal is to answer several key questions with respect to Web-document sharing, for example:
Figure 2 plots total Web requests per 5 minute period over the one-week trace period. The shading of the graph divides the curve into three areas: the darkest portion shows the fraction of requests that are initial (first) requests to objects, while the medium grey portion shows the subset that are duplicate (repeated) requests to documents. A request is considered a duplicate if it is to a document previously requested in the trace by any client. The lightest grey color shows those requests that are both duplicate and cacheable, as we will discuss later.
Overall, the data shows that about 75% of requests are to objects previously requested in the trace. This matches fairly closely the results of Duska et al. on several large organizational traces [13]. The percentage of shared requests rises very slowly over time, as one might expect. From our one-week trace, we cannot yet see the peak; however, this analysis does not consider document timeouts or replacements, therefore the 75% is optimistic if used as a basis for prediction of cache behavior. Furthermore, we cannot tell from the figure how many of the requests to a shared object were duplicate requests from the same client; overall, we found that about 60% of the requests to shared documents were first requests by a client to those documents; 40% were repeated requests by the same client.
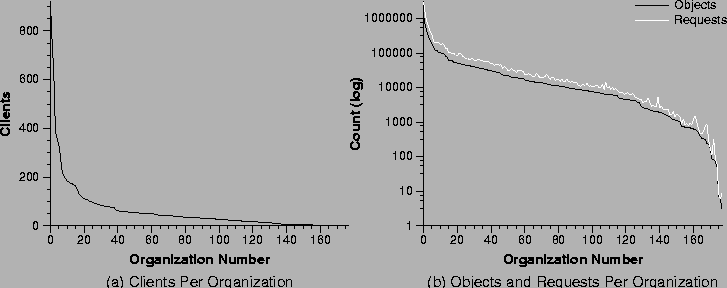
A key component of our data is the encoding of the organization number, which allows us to identify each client as belonging to one of the 170 active university organizations. These organizations include academic and administrative departments and programs, dormitories, and the university-wide modem pool. Figures 3a and 3b show the organization size, the request rate, and number of objects accessed by each organization. There are several very large organizations, with most somewhat smaller. The largest organization has 919 ``anonymized'' clients, the second largest organization is the modem pool with 759 clients, and the third largest organization has 626 clients.1 The top 20 organizations all have more than 100 clients, as shown by the labels in Figure 5. Because of the way that client IP addresses are anonymized, we cannot uniquely identify an individual client, i.e., each anonymized client address could correspond to up to 4 separate clients. For this trace the ratio of ``real'' clients to ``anonymized'' clients measured by the low levels of our trace software is 1.67; therefore, our 13,701 anonymized clients represent 22,984 true clients.
Using the organization data, we can analyze the amount of object sharing that occurs both within and between organizations.
 |
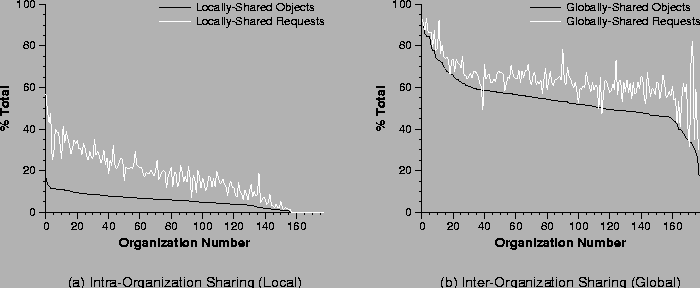 |
Figure 4a shows intra-organization (local) sharing from the perspective of both objects and requests. The black line shows the percentage of all objects accessed by each organization that are locally-shared objects, i.e., accessed by more than one organization member. The light grey line shows the percentage of all organization requests that are to these locally-shared objects. The organizations are ordered by decreasing locally-shared object percentage. From our data on intra-organization sharing we can make the following observations:
dogroups -multi=true_shared_reqs_per_obj
On average, 9.0% of requests are first requests to an object within an organization.
Most local sharing is between two clients. The number of true requests to an object corresponds to the number of clients that access that object, and the number of true requests per locally-shared object is 2.0 on average in each organization.
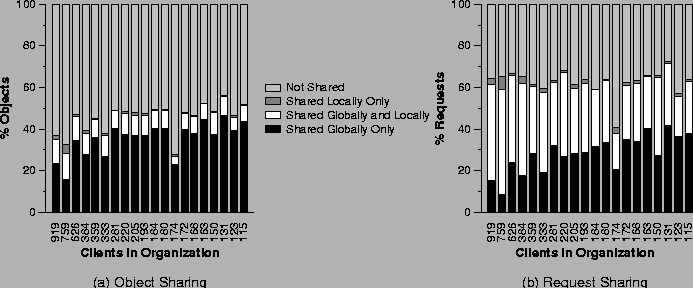 |
Figure 4b shows the inter-organization (global) sharing activity. Here the black line shows the percentage of all objects accessed by each organization that were also accessed by at least one other organization; we call such objects globally-shared objects. Similarly, the light grey line shows the percentage of all requests by an organization to globally-shared objects. The organizations are ordered by decreasing globally-shared object percentage. From our data on inter-organization sharing we can make the following observations:
dogroups -multi=global_shared_objs_frac
dogroups -multi=global_shared_reqs_frac
dogroups -multi=global_shared_reqs_per_obj
dogroups -multi=global_true_shared_reqs_per_obj Very few clients within each organization access globally-shared objects. The faction of true shared requests per globally-shared object is 1.0.
A key question raised by these figures is whether the objects shared within an organization are the same set of objects that are shared across organizations. Figure 5a shows, for the 20 largest organizations, a breakdown of organization-accessed objects into various sharing categories: local only, global only, local and global, and not shared. Figure 5b shows the same breakdown by request. The graphs are ordered in decreasing organization size, with the organization size shown on the x-axis.
From Figure 5b, we see that the fraction of requests to shared objects is fairly flat across these organization sizes. As we would expect, the fraction that are shared globally-only rises somewhat with decreased organization size, while the fraction that are locally-shared decreases with decreasing organization size. That is, in general, the smaller the organization, the less organization-internal sharing, and the more global sharing. Looking at the white section of the bars in both figures, we see that the small percentage of objects that account for both local and global sharing are very hot, and account for a much greater fraction of the requests than the objects they represent. In contrast, the percentage of requests to objects shared locally-only is very small for these organizations.
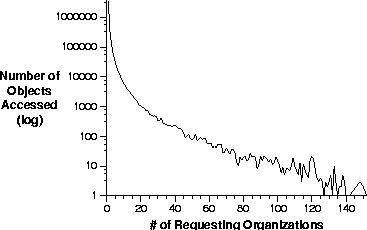
To aid in the understanding of the degree of object sharing, Figure 6 plots the number of objects (on the y-axis) that were shared by exactly x organizations. Most objects are accessed by only one organization, as shown by the steepness of the curve at x=1. We also found that there were more than 1000 objects accessed by 20 organizations and more than 100 objects accessed by 45 organizations.
 |
A key question with respect to our sharing data is whether organization membership is significant. To answer this question, we randomly assigned clients to organizations, and compared the inter- and intra-organization sharing in the random assignments with the sharing seen in our trace analysis presented above. (The random organizations had the same sizes as the actual organizations.) Figure 7a plots the fraction of requests to locally-shared objects of the trace organizations and three randomly-assigned organizations. From the figure, we see that over all of the organizations sharing is higher in the real organizations than in the randomly-assigned organizations. In other words, there is locality of references in organization membership. Figure 7b plots the fraction of requests to globally-shared objects for the trace and for the three random organizations. As expected, there is no significant difference in the amount of global sharing between the real trace and the randomized organization assignment.
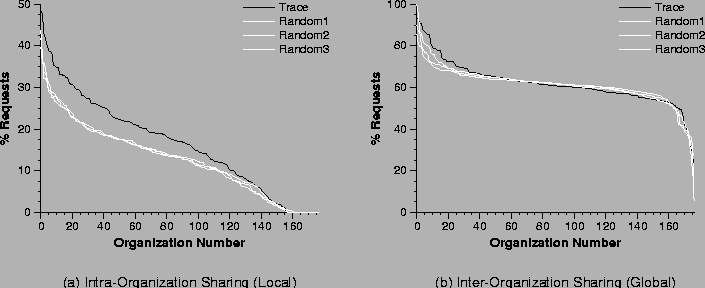 |
The organization-oriented data show that there is, in fact, significance to organization membership. Members of an organization are more likely to request the same documents than a set of clients of the same size chosen at random. However, the vast majority of the requests made are to objects that are globally shared. In addition, objects that are shared both locally within an organization and globally with other organizations are more likely to be requested by an organization member. This suggests that the most requested objects are universally popular.
For another aspect of sharing patterns we examine the servers that are being accessed and server proximity (i.e., which servers are close to each other in the network).
Figure 8 shows the cumulative distribution functions of both server popularity and server subnet popularity, where popularity is measured by the request-count. The byte-count curves for server popularity and server subnet popularity are effectively identical to the request-count curves shown in the graph. The data indicates that 50% of the objects accessed and bytes transferred come from roughly the top 850 servers (out of a total of 244,211 servers accessed). A server subnet is a set of servers that share the same first 24 bits of their IP addresses. Such groups of servers are typically mirrors of each other, or at least sit in a single server farm owned by a single company. We see that 50% of the objects come from about the top 200 server subnets; 18% come from the top 20 subnets.
This section examines cacheability of documents, giving us insight into the potential effectiveness of proxy caches in our environment. Web proxy caches are a key performance component of the WWW infrastructure; their objective is to improve performance through caching of documents requested more than once. Proxies typically live at the boundaries of an organization, caching documents for all clients within that organization.
In Figure 2 we saw a time-series graph of the percentage of duplicate requests (i.e., requests to a previously-accessed document) and cacheable requests in our trace. The cacheable requests are those made to documents that would be cached by a standard proxy cache, such as Squid [25]. We found that, in steady state, approximately 45% of the requests are duplicate and cacheable, placing an upper bound on the hit rate. The wide difference between the duplicate line and the cacheable line indicates that only about half of the duplicate requests (which could benefit from caching) are to objects that are cacheable.
Our cacheability analysis is based on the implementation of the Squid proxy cache. We examined the policies implemented by both Squid version 1 and Squid version 2. There are several reasons why a Squid proxy may consider a document uncacheable.
Figure 9 shows a breakdown of all HTTP requests, detailing the percentage that are uncacheable for each of the reasons listed above. As the figure shows in the bar labeled ``Overall_Uncache'', 40% of the requests are uncacheable for one or more of the itemized reasons. Queries and Response Status are the two major reasons for uncacheability. Adding up the percentages for each reason sums to an amount greater than the overall uncacheability rate, showing that many documents are uncacheable for more than one reason. The figure also shows, for each itemized reason, the percentage of HTTP requests that are uncacheable only due to that reason. Finally, the figure shows that 16% of Web requests are uncacheable for two or more reasons. Figure 10 shows the most common content types for the uncacheable documents.
 |
Our intent in analyzing the cacheability of documents is to show which requests a deployed proxy cache would be allowed to store if it were given the request stream from our trace. However, one should not infer from our analysis that all of the uncacheable requests are truly dynamic content. Web content providers may choose to mark documents uncacheable for other reasons, such as the desire to track the behavior of individual users. Figure 10 shows that more than 12% of all the uncacheable documents have the image/gif content type, and we suspect that very few of these images are truly dynamic content.
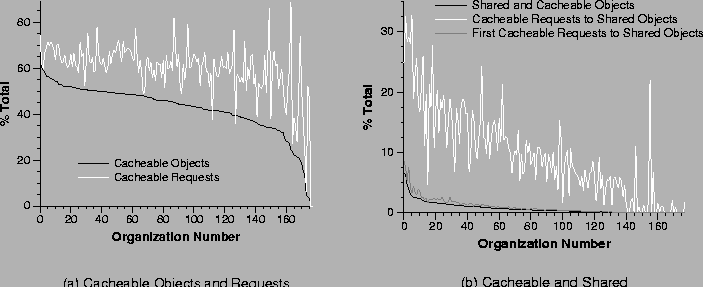
Figure 11a shows, for each organization, the percentage of objects (black line) requested by the organization that are potentially cacheable. The light grey line shows, for each organization, the percentage of requests whose responses are cacheable. The figure shows that the percentage of cacheable objects is somewhat lower than the percentage of cacheable requests. The percentage of cacheable requests gives an upper bound on the hit rate each organization could see with an organization-local proxy cache.
Figure 11b shows, for each organization, the percentage of cacheable shared objects (the black line), and the percentage of cacheable shared requests in two categories. The medium grey line shows those first requests by an organization to globally shared objects. The light grey line shows the total number of requests by an organization to globally shared objects. The difference between these two lines represents the duplicate requests by an organization to globally shared objects. If each organization has its own cache, then the local cache can handle all duplicate requests whether or not there is a global cache. If there is a global cache in addition to the local caches, then the global cache will miss on the first request by any of the organizations, but will hit on all the first requests by other organizations that follow. One can conclude from this graph that there is significant sharing among organizations (as shown by the light grey line), but that a large fraction of that sharing is captured just with organizational caches (as shown by the difference between light and medium grey lines). Therefore, a global cache in addition to the local caches will help, but not nearly to the degree indicated by the amount of sharing among organizations. Another interesting question is whether a single global cache would be better than using local caches. We explore this question in a related paper [26].
A last factor that can affect the performance of caching is object expiration time. We found overall that only 9.2% of requests had an expiration specified. Most of these requests are to objects that expire quickly; 47% are to objects that expire in less than 2 hours. Interestingly, of those that did have an expiration specified, 26% had a missing or invalid date and 29% had an expiration time that had already passed.
Finally, we have not presented detailed cache simulations here; our objective is simply to analyze cacheability of documents in the most recent data. From our data, it appears that the trends with respect to cacheability of documents are getting worse. For example, our measurement that 40% of all document accesses are uncacheable is significantly higher than the 7% reported for client traces at Berkeley in 1997 [16]. Without widespread deployment of special mechanisms to deal with caching, such as caching systems that handle dynamic content [7,8], the benefits of proxy caching are not likely to improve.
In this paper, we have collected and analyzed a large recent trace taken in a university setting. Our study has focused on sharing of Web documents within and among a diverse set of organizations within a large university.
We can reach the following conclusions from our data:
When analyzing these conclusions, one must keep in mind that we do not know how similar our university organizations are to typical commercial organizations that connect to the Internet, but we hope to investigate this question in future work. We have only begun to analyze the data we have collected. Other future work includes a more detailed statistical analysis of various aspects of the data already collected as well as a study of the evolution of WWW traffic characteristics over time. Towards this end, we plan to repeatedly trace and examine Web traffic at the University of Washington.
We would particularly like to thank Steve Corbato, Art Dong, Corey Satten, and the other members of the Computing and Communications organization at UW, who supported our effort. We also wish to thank Geoff Kuenning for his diligent shepherding that added greatly to the clarity of the paper. This research was supported in part by DARPA Grant F30602-97-2-0226, National Science Foundation grant EIA-9870740, US-Israel Binational Science Foundation grant 96-00247, and an IBM Graduate Research Fellowship.