|
|
|

|
|
Project 1
Out: Monday March 26
Due: Wednesday April 4 (midnight)
Turnin: Online
Teams: Pairs
Assignment Overview
We'll give you a nearly-completely implemented client-server application, ask you to record
some measurements it provides of network performance, and then ask you to do a bit of
analysis based on the measurements. You'll turn in a short report summarizing your
analysis.
A major goal of this assignment is to verify that you have set up the infrastructure
required to do future projects. This includes forming a team, figuring out on what
platform you will work, making sure you can deal with Eclipse and its Android plugins,
run the Android emulator and the Android phone, and install your (or in this case our)
software on them. You won't turn in anything that demonstrates these things directly,
but you should make sure you're reasonably comfortable with the build and run process by the end
of the assignment. You'll also write approximately two lines of Java to create a TCP client socket
and connect to a remote server. (Once established, a socket looks a lot like a file, so your
experience reading/writing files in Java applies to them.)
Summary of What You'll Do
- You'll set up your build environment. A link to a page describing how is at the end of this page.
- You'll then fetch the Project 1 code and get it working with Eclipse.
A link to a page describing how is at the end of this page.
- You'll then change two lines of code, resulting in a fully working application.
A link to a page describing how is at the end of this page.
- Finally, you'll run some experiments, analyze the results you get, write a short report,
and hand in (only) that report. That's the heart of the
conventional assignment part of this project. That is described on this page.
The Application, Measurements, and Analysis
The application examines one issue of communication: the importance of clock recovery when sampling
an incoming data stream. Abstractly, the ideas are most closely related to the Clock Recovery
portion of Section 2.5 of the text. We'll be operating far above the physical layer that section
talks about, though.
The application is client-server. The server code is launched on some machine, initializes,
and sits waiting for clients to connect to it. When clients are launched, they try to connect to the
server. If successful, both sides end up with an operating system object, a socket, that
represents the pairwise connection between the server and that client. Writing
to the socket sends data to the other end; reading from the socket blocks until some data arrives.
More than one client can connect to the server at a time (for reasons we will discuss a bit
later in the course).
The Server
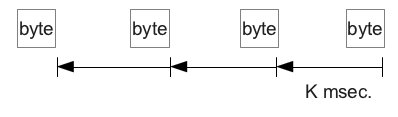
The server in our application simply sits in a loop sending data to the client at a fixed rate,
for example, one character every 10 millseconds. You can think of it as an OTA (over-the-air)
TV station. It expects no data from the client, it simply sends.
The Asynchronous Client
The interesting part of the client reads data at the same fixed rate. It's asynchronous in the sense
that there is no explicit communication between it and the server about when an inter-symbol period
has expried. Every 10 milliseconds, say,
it looks at the last character received from the server and assumes that whatever it finds is the
next character the server sent. Sometimes it is, sometimes it isn't: it may have missed a character,
or read one twice.
Even though both sides are using 1/10msec. as their
base rate, the client will make mistakes. At the level of Section 2.5 of the text, these occur
because it's impossible to make two clocks (the server's and the client's) run at exactly the same rate
forever without some kind of periodic synchronization.
Because our client and server are normal applications, connected over the Internet, there are many sources
of deviation from the ideal 1/10msec. at both ends: the OS scheduler is not perfect; the Internet imposes
"jitter" that means even if the server sent perfectly at 1/10msec., consecutive characters would sometimes
arrive at the client with a larger separation in time and sometimes with a smaller one; finally (and by far the smallest
contributor for our setup) the clocks on the two machines won't agree exactly on just how long 10 msec. is.
The Synchronous Client
The client contains two threads. One implements the asynchronous read strategy just described. The other
simply reads the data coming in on the TCP connection. TCP is reliable, and so that threads sees exactly what
the server sent. We refer to this as the synchronous client because it is exploiting the synchronization mechanisms
built in the layers below it. (In the programming sense, there is only one client object, implementing both
the asynchronous and synchronous receive mechanisms. Logically, there are two.)
Measurements
The client measures how many consecutive characters it can read asynchronously before making a mistake.
It does this by comparing what it receives asynchronously against the correct, synchronous stream.
Driver code repeats the experiment multiple times, because there is a lot of variation in when the first mistake occurs.
The server implements a mechanism that allows the client to decide at what rate it wants to receive data:
the server controls many TCP ports, and each one has a distinct, associated send rate.
Analysis Overview
Intuitively, lower transmission rates (larger inter-symbol times) should allow the client to read correctly for longer, and
higher transmission rates provoke mistakes more quickly.
On the other hand, lower rates are delivering data more slowly. Suppose our goal is to maximize goodput,
the rate at which we receive correct data. What rate should we run at?
Analysis Details: What to Turn In
Report Part A: Experimental Setup
Give some basic information:
- Who your group members are.
- For the client and server machines used in your experiments,
describe the machine. If it's a CSE machine, just give its name. If it's not,
tell us what OS it's running and where it's located (geographically, e.g., "Ballard," or as best you can when that isn't clear,
e.g., "Amazon").
- Cut-and-paste the output of traceroute from the client to the server. Here are some
sample invocations, assuming you use our server. (Replace the server name with your server's name or IP address, if not.)
- Linux:
$ traceroute cse461.cs.washington.edu
- Windows:
C:> tracert cse461.cs.washington.edu
- Mac: I don't know, but I'd try the Linux command, and if that doesn't work do a web search.
If at all possible, try to run the client on a machine that is remote, in terms of network distance, from the server.
We're running a server in CSE that you're likely to use, so most often that will mean trying to run the client on
a non-CSE (and preferably non-UW) machine. If doing so is extravagantly difficult, or simply impossible, that's okay,
do the best you can. (You can all do better than running both the client and server on a single machine!)
Report Part B: Oracle Reception
We'll asume in this part that client can somehow reliably detect when an error occurs (thus the "Oracle").
The goal is to suggest a sending rate that maximizes goodput, the rate at which the client recieves correct characters,
under these assumptions: the server is always sending and the client is always receiving; that each reception is terminated by a mistaken character,
which takes time but doesn't add to goodput; that any two
attempts to receive data from the server are independent of each other (in the probabilistic sense); that your experiments were independent
trials.
To do this, you'll run repeated experiments at a number of different sending rates.
Each experiment will give you a sample for how many characters are successfully sent before an error occurs, at that rate.
The set of experiments run at a single rate give you a sampled distribution of the number of characters received before
error at that rate. Use that distribution to estimate the goodput achieved, on average, at that rate.
Include in the report two things:
- A graph with sending rate on the X-axis and average goodput on the Y-axis. Sending rate should be measured in
characters/second, and is simply the inverse of the inter-symbol time. Goodput is also measured in characters per second.
- Some text in which you suggest "the best sending rate," based on your experiments, and support that selection. Your explanation
of what you did to come to this conclusion should be specific enough that the reader can make an independent decision about whether
or not the conclusion is valid.
Part C: More Realistic Reception
Real data transmission is slightly more complicated than what we have assumed so far. Here we introduce some
more realistic elements, and re-evaluate the choice of sending rate that maximizes goodput.
Assume now that the server sends an unending and uninterrupted sequence of frames, fixed length series of bytes.
Each frame starts with
a preamble, a bit sequence that the receiver can recognize as the start of a new frame,
and that allows it to re-synchronize the rate of its clock with that of the sender.
After that is a fixed amount of data. Finally, there is a CRC (cyclic redundancy check) field. The CRC
allows the receiver to determine whether it received the entire frame correctly or not. If not, it discards
the frame. If so, it extracts that data portion of the frame and that contributes to goodput.
| Preamble (8 bytes)
| Data (N bytes)
| CRC (4 bytes)
|
There are now two choices to make: the sending rate and the size of the frame. (The frame size is N + 12 bytes.)
Using the experimental you have already collected, hand in the following:
- A recommendation for the choice of sending rate and frame size that maximizes goodput, and a brief
explanation of how you came to that recommendation.
- A graph (derived from your experimental data) that supports your choice.
Setup Details
There are two primary issues to setup: the general one of getting your build/test environment set up, and the
specific code base used in this project.
- Setting up Eclipse + Android
- Setting up The Project 1 Projects
Project 1 Software: Modifications and Execution
You have to make some very minor changes to the distributed software, and then
use it to do the analysis described earlier on this page. A separate page
describes the software architecture, and how to run the software.
- The Project 1 Source
|